Tag Archives: ECG

Spot the WOBBLER in syncope!

Syncope is a common ED presentation. An ECG is a critical investigation in syncope to identify the cause, including rare conditions associated with risk of sudden cardiac death.
So we should be really grateful when we are invited to interpret an ECG while we’re in the middle of six other tasks.

The problem with syncope is that some of the important life-threatening causes have fairly obscure ECG features that might be hard to remember. Some of these disorders and their ECG features are not entirely familiar to the clinicians who first screen the ECG.

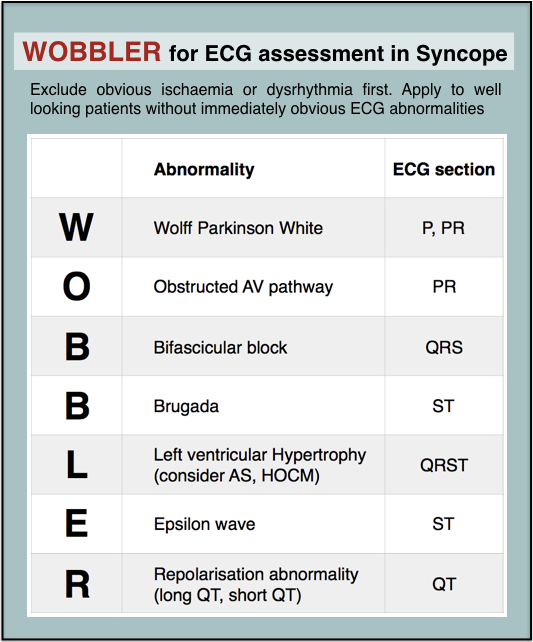
When you’re busy and cognitively stretched you can save time and reduce the risk of missing important findings by having a structured, memorable checklist. I use the acronym WOBBLER, because I don’t want these people to wobble and kiss the dirt again.

The nice thing about WOBBLER is that it uses the sequence that you follow when you look at an ECG, ie from left to right, or from P wave to T wave.

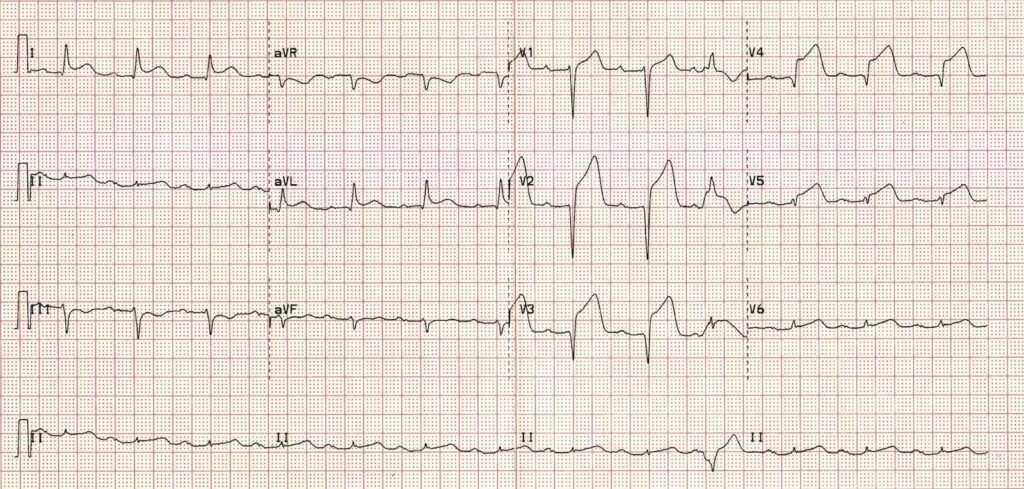
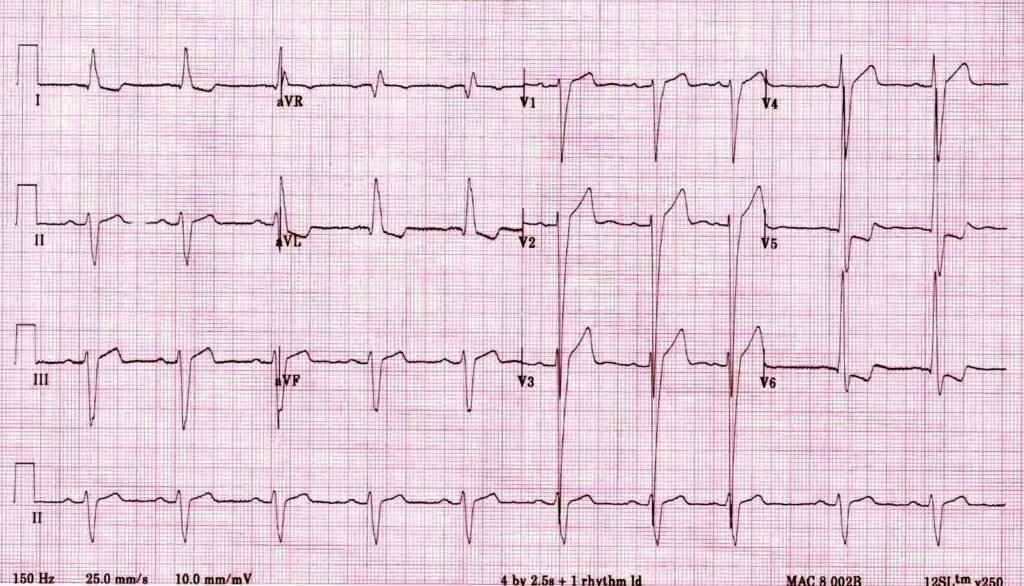
The key is that this is for ECGs without obvious ischaemia or dysrhythmia. If you see something like this (STEMI):
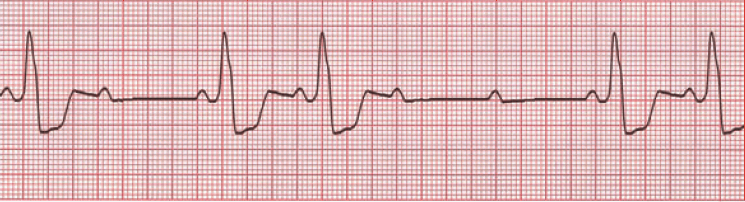
or this (VT):

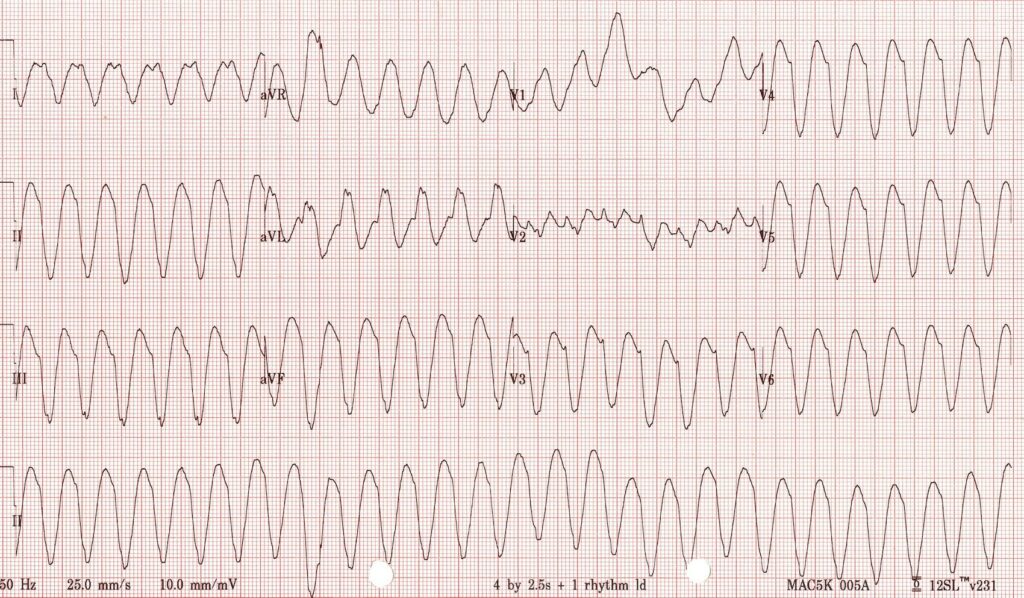
you don’t need WOBBLER, you need to be treating that patient.

So we apply WOBBLER to screen the ECG of well-looking syncope patients without obvious ischaemia or dysrhythmia.

Here goes…

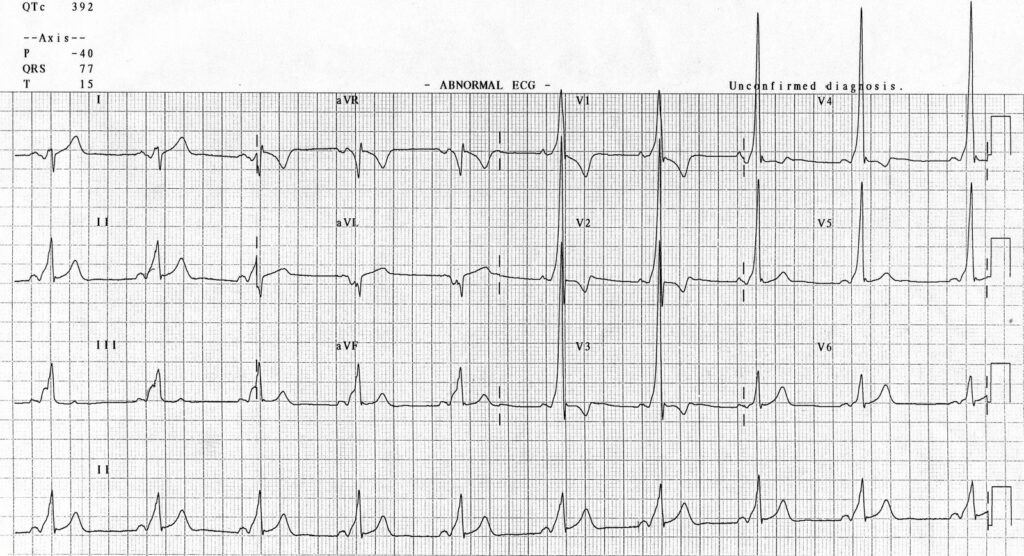
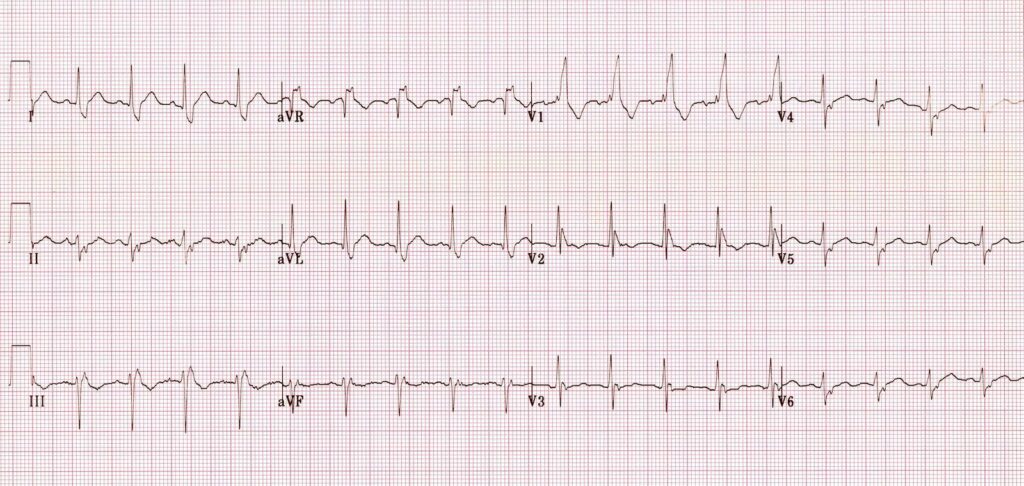
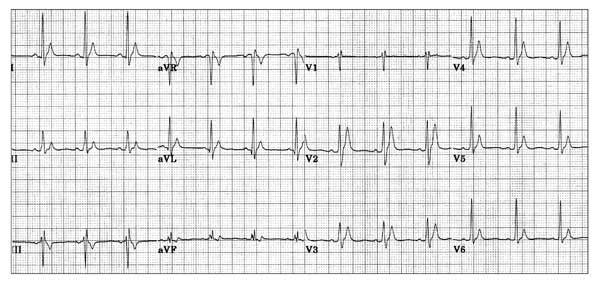
W is Wolff-Parkinson-White syndrome – look for a short PR interval or delta wave:

O is obstructed AV pathway – look for 2nd or 3rd degree block:

or axis deviation:

…which is the first step in looking for B bifascicular block, or the combination of axis deviation and right bundle branch block:

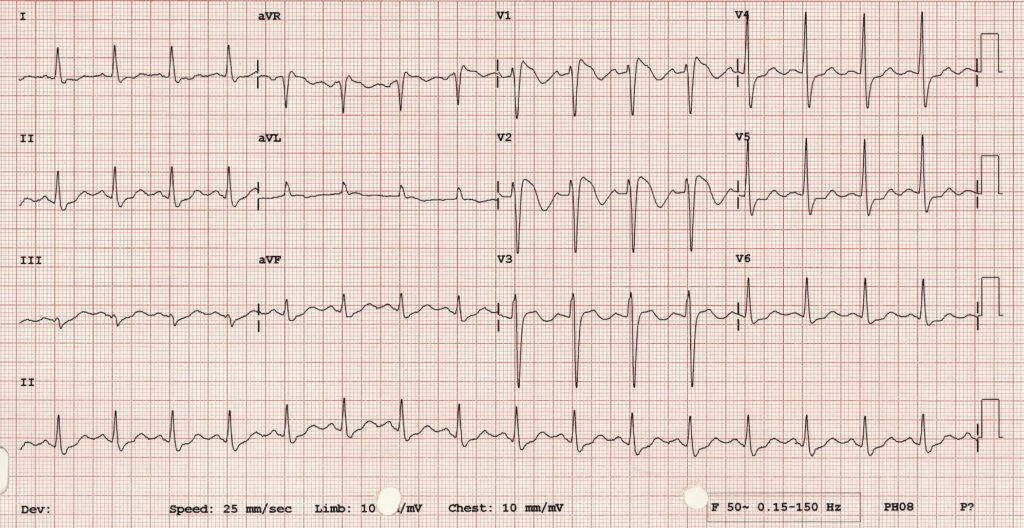
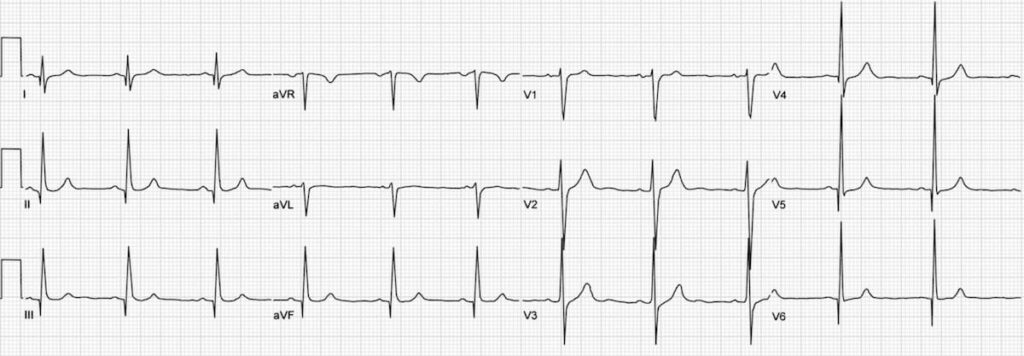
the second B is Brugada, looking for characteristic morphology of the ST segment, so called coved ST elevation:

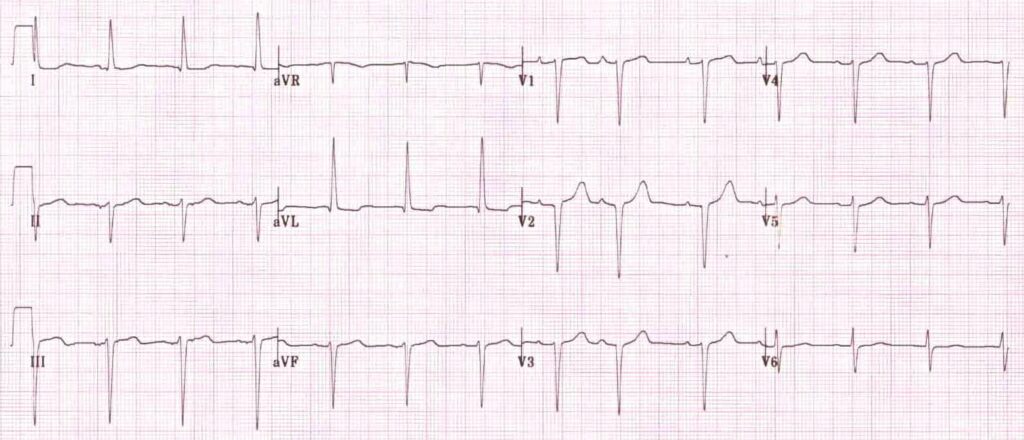
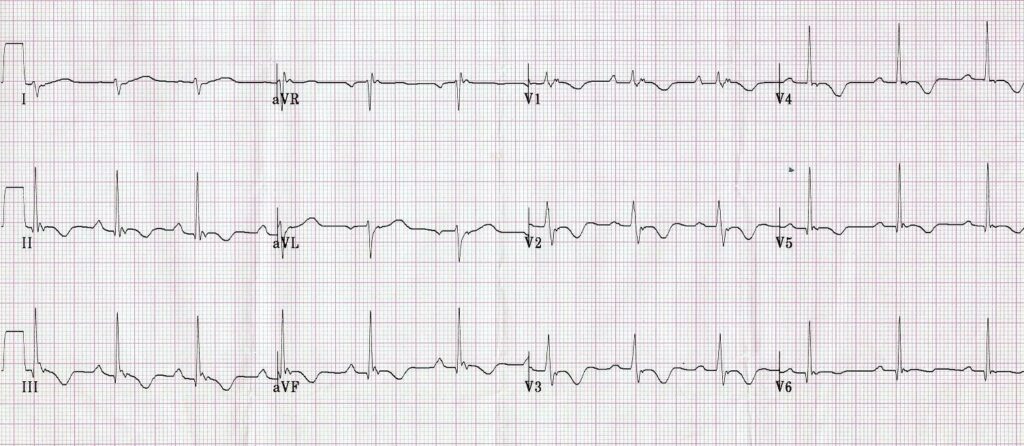
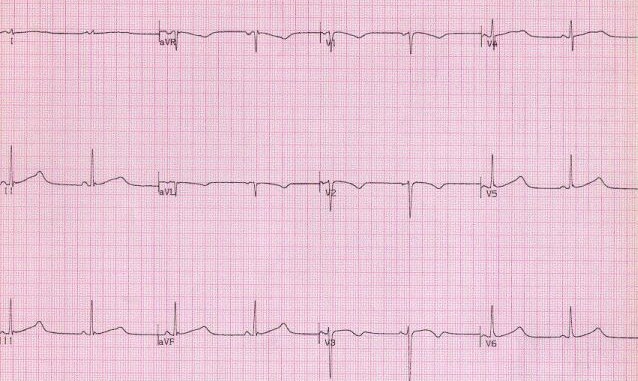
Now syncope, especially exertional syncope, can be caused by left ventricular outflow tract obstruction. Two conditions not to be missed associated with LVOTO (and exertional syncope) are hypertrophic cardiomyopathy and aortic stenosis. These both characteristically cause Lleft ventricular hypertrophy:

This example of Hypertrophic Cardiomyopathy has voltage criteria for LVH in the precordial leads as well as narrow, “dagger-like” Q waves in lateral and inferior leads

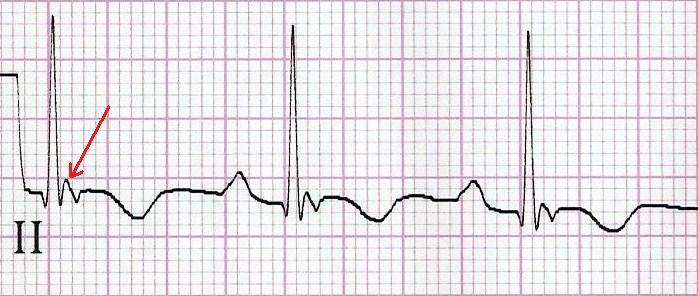
E– stands for epsilon wave, a feature of arrythmogenic right ventricular dysplasia, a rare disorder associated with sudden cardiac death. The epsilon wave looks a bit like the J wave of hypothermia and may be associated with other T wave abnormalities in V1-V3:

Epsilon wave in more detail

Finally, R stands for Repolarisation abnormality, particularly delayed Repolarisation as found in long QT syndrome:

but remember there is also a short QT syndrome too:

So WOBBLER may help you find the important and rare abnormalities not to be missed in the syncope patient, going from left to right from P wave through to T wave, in the patient that does not have obvious dysrhythmia or ischaemia. I hope you find it a helpful cognitive forcing tool.

All ECGs reproduced with kind permission of Life in the Fast Lane

The 'Magic Eye®' method of rhythm assessment

Are you someone who tries to determine whether an ECG trace is ‘irregularly irregular’ by drawing little dots on a piece of paper level with the R waves to see if they are evenly spaced? I’d done that for years until I read this fantastic suggestion, which I’ve been following for over a year now.
In the 1990s there was a popular series of posters and books called ‘Magic Eye‘. These contained a ‘random dot autostereogram‘ which appeared as a mish-mash of coloured dots, but when you stared at it for a while the illusion of a 3D image would emerge. They looked a bit like this (although this one won’t work at such reduced resolution):

Image Credit: Wikimedia Commons

Dr Broughton and colleagues from Cambridge, UK, discovered that this technique, which involves forcing a divergent gaze to get repeating patterns to appear to overlap, can be applied to an ECG trace.
Stereoviewing an ECG trace causes successive QRS complexes to visually overlap and produce a new image. As Broughton and colleagues point out:
When achieved, this will lead to one of three outcomes. Entirely regular rhythms will ‘click’ into place as a new image at fixed depth. Rhythms with only mild irregularity may be stereoviewable, and if so, will appear to show successive QRS complexes at subtly varying depths. Rhythms with marked irregularity will not be stereoviewable, instead (in our experience) merely giving the viewer sore eyes after several failed viewing attempts.”
The authors assert that this can be applied to continuous ECG monitors, although unless you are really good at stereoviewing while moving your head/eyes horizontally, you should really freeze the trace on the screen first.
The ‘Magic Eye®’ method of rhythm assessment
Anaesthesia. 2012 Oct;67(10):1170-1

Isolated LAFB and outcome

A small study followed up an older cohort of patients with isolated left anterior fascicular block on their ECG (isolated left axis deviation), without clinically manifest cardiovascular disease.

LAFB-litfl
Learn about LAFB at Life In The Fast Lane

LAFB was associated with an increased risk of atrial fibrillation, heart failure and death. LAFB is caused by conduction tissue fibrosis, and is a marker of other left heart fibrosis. The patients did not go on to develop left bundle branch block, and only 2 of 39 required pacing in 10 years, suggesting these outcomes were not due to progression of conduction disease.

Long-term Outcomes of Left Anterior Fascicular Block in the Absence of Overt Cardiovascular Disease
JAMA. 2013 Apr 17;309(15):1587-8

T waves in V1-V3 were not associated with badness

This long term follow up study showed that T-wave inversions in right precordial leads are not associated with adverse outcome.

No worries, mate

Yikes!


Background-: T-wave inversion in right precordial leads V1 to V3 is a relatively common finding in a 12-lead ECG of children and adolescents and is infrequently found also in healthy adults. However, this ECG pattern can also be the first presentation of arrhythmogenic right ventricular cardiomyopathy. The prevalence and prognostic significance of T-wave inversions in the middle-aged general population are not well known.

Methods and Results-: We evaluated 12-lead ECGs of 10 899 Finnish middle-aged subjects (52% men, mean age 44+/-8.5 years) recorded between 1966 and 1972 for the presence of inverted T waves and followed the subjects for 30+/-11 years. Primary end points were all-cause mortality, cardiac mortality, and arrhythmic death. T-wave inversions in right precordial leads V1 to V3 were present in 54 (0.5%) of the subjects. In addition, 76 (0.7%) of the subjects had inverted T waves present only in leads other than V1 to V3. Right precordial T-wave inversions did not predict increased mortality (not significant for all end points). However, inverted T waves in leads other than V1 to V3 were associated with an increased risk of cardiac and arrhythmic death (P<0.001 for both).

Conclusions-: T-wave inversions in right precordial leads are relatively rare in the general population, and are not associated with adverse outcome. Increased mortality risk associated with inverted T waves in other leads may reflect the presence of an underlying structural heart disease.

Prevalence and prognostic significance of T-wave inversions in right precordial leads of a 12-lead electrocardiogram in the middle-aged subjects
Circulation. 2012 May 29;125(21):2572-7

STEMI criteria vary with age and sex

On reading through the 2010 American Heart Association Guidelines for Cardiopulmonary Resuscitation and Emergency Cardiovascular Care Science – Part 10: Acute Coronary Syndromes, I found a reminder that the ECG criteria for diagnosing ST-elevation myocardial infarction (STEMI) vary according to age and sex. From the original article in the Journal of the American College of Cardiology:

The threshold values of ST-segment elevation of 0.2 mV (2 mm) in some leads and 0.1 mV (1 mm) in others results from recognition that some elevation of the junction of the QRS complex and the ST segment (the J point) in most chest leads is normal. Recent studies have revealed that the threshold values are dependent on gender, age, and ECG lead ([8], [9], [10], [11] and [12]). In healthy individuals, the amplitude of the ST junction is generally highest in leads V2 and V3 and is greater in men than in women.
Recommendations

  1. For men 40 years of age and older, the threshold value for abnormal J-point elevation should be 0.2 mV (2 mm) in leads V2 and V3 and 0.1 mV (1 mm) in all other leads.
  2. For men less than 40 years of age, the threshold values for abnormal J-point elevation in leads V2 and V3 should be 0.25 mV (2.5 mm).
  3. For women, the threshold value for abnormal J-point elevation should be 0.15 mV (1.5 mm) in leads V2 and V3 and greater than 0.1 mV (1 mm) in all other leads.
  4. For men and women, the threshold for abnormal J-point elevation in V3R and V4R should be 0.05 mV (0.5 mm), except for males less than 30 years of age, for whom 0.1 mV (1 mm) is more appropriate.
  5. For men and women, the threshold value for abnormal J- point elevation in V7 through V9 should be 0.05 mV (0.5 mm).
  6. For men and women of all ages, the threshold value for abnormal J-point depression should be −0.05 mV (−0.5 mm) in leads V2 and V3 and −0.1 mV (−1 mm) in all other leads.

What does establishment of abnormal J-point mean for STEMI diagnosis? The AHA/ECC guidelines state the following:

ST-segment elevation… is characterized by ST-segment elevation in 2 or more contiguous leads and is classified as ST-segment elevation MI (STEMI). Threshold values for ST-segment elevation consistent with STEMI are:

  • J-point elevation 0.2 mV (2 mm) in leads V2 and V3 and 0.1 mV (1 mm) in all other leads (men ≥40 years old);
  • J-point elevation 0.25 mV (2.5 mm) in leads V2 and V3 and 0.1 mV (1 mm) in all other leads (men <40 years old);
  • J-point elevation 0.15 mV (1.5 mm) in leads V2 and V3 and 0.1 mV (1 mm) in all other leads (women).

So, in summary:

Older men – 2mm in V2/V3 and 1mm everywhere else
Younger men – 2.5 mm in V2/V3 and 1mm everywhere else
Women – 1.5 mm in V2/V3 and 1mm everywhere else

Shouldn’t be too difficult to remember.
Part 10: acute coronary syndromes: 2010 American Heart Association Guidelines for Cardiopulmonary Resuscitation and Emergency Cardiovascular Care.
Circulation. 2010 Nov 2;122(18 Suppl 3):S787-817
AHA/ACCF/HRS recommendations for the standardization and interpretation of the electrocardiogram: part VI: acute ischemia/infarction: a scientific statement from the American Heart Association Electrocardiography and Arrhythmias Committee, Council on Clinical Cardiology; the American College of Cardiology Foundation; and the Heart Rhythm Society. Endorsed by the International Society for Computerized Electrocardiology.
J Am Coll Cardiol. 2009 Mar 17;53(11):1003-11

RV involved in AMI more often than you think

We know that inferior STEMI may be complicated by right ventricular involvement, which is why I whack a V4R lead on all my inferior AMI patients. A recent study using cardiac magnetic resonance imaging showed that RV oedema and regional or global RV dysfunction were common in anterior infarcts too, although the proportion significantly decreased at four month follow up.

T2w image of patient with LAD occlusion. Hyperintense appearance of jeopardised anteroseptal and anterior LV myocardium (arrowheads), extending to adjacent RV lateral free wall (arrows)

RV abnormalities are contiguous to the jeopardized LV myocardium and do not occur exclusively in inferior LV infarcts, but are found in up to 33% of anterior LV infarcts as well. The presence of RV ischemic injury is associated with early RV dysfunction as well as with RV functional recovery at follow-up.
Right Ventricular Ischemic Injury in Patients With Acute ST-Segment Elevation Myocardial Infarction: Characterization With Cardiovascular Magnetic Resonance.
Circulation. 2010 Oct 5;122(14):1405-12

Swimming the Channelopathy

Drowning is one of the leading causes of accidental death in children. Some apparent drownings may be related to sudden cardiac death, in particular to unidentified channelopathies, which are known to precipitate fatal arrhythmias during swimming-related events.
The majority of cases of sudden cardiac death in children and adolescents are secondary to either hypertrophic or right ventricular cardiomyopathy with coronary artery abnormalities also prevalent, and reports have demonstrated these cardiac abnormalities on autopsy following sudden swimming-related deaths.
However, the majority of autopsies in swimming-related sudden deaths are normal suggesting causation at molecular level, in particular ion channel defects such as type 1 long-QT syndrome (LQT1) and catecholaminergic polymorphic ventricular tachycardia (CPVT).

The gene deletion in LQT1 (KCNQ1) leads to a reduction in the repolarising potassium current (IKs) and prolongation of repolarisation. This lengthens the QT interval (which may be lengthened further by facial immersion in cold water). A premature ventricular contraction (PVC) again which may be initiated by swimming occurring during the vulnerable part of repolarisation leads to establishment of polymorphic ventricular tachycardia (torsades de pointes).

The ryanodine receptor gene mutation (RyR2) in catecholaminergic polymorphic ventricular tachycardia leads to defective closure of the receptor on the surface of the sarcoplasmic reticulum during diastole. This leads to increased calcium (Ca2+) leakage from the sarcoplasmic reticulum and increased potential for delayed afterdepolarisations and subsequent ventricular tachycardia.

Some recommendations are made in an article in Archives of Disease in Childhood:
Proposed implementations to improve detection and appropriate management of apparent drownings secondary to cardiac channelopathies

  1. Improving awareness in the coronial service of the possibility of a cardiac cause for poorly explained drownings.
  2. Education of lifeguards and provision of automated defibrillators in swimming pools.
  3. Molecular autopsy for non-survivors to look for potential channelopathies.
  4. Screening for survivors and family members of non-survivors to identify those with a channelopathy.
  5. Proper counselling for those identified to have a channelopathy on family screening.

Drowning and sudden cardiac death
Arch Dis Child 2011;96:5-8

'AMI' on ICU

ECG machines may give a printed report saying ***ACUTE MI***. In a retrospective study, patients on the ICU whose 12 lead ECGs contained this electronic interpretation did not have an elevated troponin 85% of the time. Even in the minority of patients whose electronic ECG diagnosis of MI was agreed with by a cardiologist, only one third developed an elevated troponin.
The authors state ‘In contrast to nonintensive care unit patients who present with chest pain, the electrocardiographic ST-segment elevation myocardial infarction diagnosis seems to be a nonspecific finding in the intensive care unit that is frequently the result of a variety of nonischaemic processes. The vast majority of such patients do not have frank ST-segment elevation myocardial infarction.’
Electrocardiographic ST-segment elevation myocardial infarction in critically ill patients: An observational cohort analysis
Crit Care Med. 2010 Dec;38(12):2304-230

Can we tell if AF is new?

One of the dilemmas in selecting appropriate therapy for atrial fibrillation in the emergency situation is determining whether the AF is of acute onset or not. AF causes release of natriuretic peptide from the heart, so measuring these peptides may give a clue to the recency of onset if the kinetics are known. This of course can only apply to those patients without heart failure, who have another cause for elevated natriuretic peptide levels.
A study of N-terminal pro-BNP levels in patients with acute onset AF, and without clinical or radiological evidence of heart failure, showed the pattern of rise and fall. The key finding in this study is the rapid rise of plasma NT-proBNP levels to peak followed by a rapid decline, probably due to depletion of the granules in atrial myocytes in which pro-BNP is stored.
The authors describe the following implication of the study:
According to our observations, a rising trend is markedly indicative of the fact that AF onset did not happen more than 24–48 h before presentation. As a consequence, obtaining two to three plasma NT-proBNP levels within 24 h of presentation in patients with AF without heart failure who cannot satisfactorily pinpoint the time of onset may assist in determining whether the onset of the arrhythmia was recent. Such information is pertinent to decisions concerning anticoagulation and cardioversion.
Short-term fluctuations of plasma NT-proBNP levels in patients with new-onset atrial fibrillation: a way to assess time of onset?
Heart. 2010 Jul;96(13):1033-6

Inferior MI – check V1 too

Lead V1 directly faces the right ventricle and during an inferior AMI may exhibit ST elevation with concomitant right ventricular infarction. Lead V1 also faces the endocardial surface of the posterolateral left ventricle, and ST depression may reflect concomitant posterolateral infarction (as the “mirror image” of ST elevation involving posterolateral epicardial leads). In this situation, V3 also shows ST depression. In lead V1, however, ST elevation from right ventricular AMI may potentially cancel out the ST depression from posterolateral AMI to give an isoelectric ST level. Diagnosis of right ventricular infarction during an inferior AMI may therefore be aided by evaluating both V1 and V3 ST levels. Both right ventricular infarction and postero-lateral infarction worsen the prognosis of an inferior AMI.
In 7967 patients with acute inferior myocardial infarction in the Hirulog and Early Reperfusion or Occlusion-2 (HERO-2) trial, V1 ST levels were analyzed with adjustment for lead V3 ST level for predicting 30-day mortality.
V1 ST elevation at baseline, analyzed as a continuous variable, was associated with higher mortality. Unadjusted, each 0.5-mm-step increase in ST level above the isoelectric level was associated with ~25% increase in 30-day mortality; this was true whether V3 ST depression was present or not. The odds ratio for mortality was 1.21 (95% confidence interval, 1.07 to 1.37) after adjustment for inferolateral ST elevation and clinical factors and 1.24 (95% confidence interval, 1.09 to 1.40) if also adjusted for V3 ST level. In contrast, lead V1 ST depression was not associated with mortality after adjustment for V3 ST level. V1 ST elevation ≥1 mm, analyzed dichotomously in all patients, was associated with higher mortality. The odds ratio was 1.28 (95% confidence interval, 1.01 to 1.61) unadjusted, 1.51 (95% confidence interval, 1.19 to 1.92) adjusted for V3 ST level, and 1.35 (95% confidence interval, 1.04 to 1.76) adjusted for ECG and clinical factors. Persistence of V1 ST elevation ≥1 mm 60 minutes after fibrinolysis was associated with higher mortality (10.8% versus 5.5%, P<0.001). The authors conclude that V1 ST elevation identifies patients with acute inferior myocardial infarction who are at higher risk, although because no myocardial imaging was performed, could only speculate that the mechanistic link between V1 elevation and increased mortality is due to the occurrence of right ventricular infarction. This is important to know about in terms of prognostication, but is it useful in the diagnosis of right ventricular AMI? The authors acknowledge that the ECG diagnosis of right ventricular infarction is classically made by recording lead V4R. In an autopsy study of 43 patients, ST elevation in lead V4R had higher sensitivity and specificity than ST elevation in lead V1 in diagnosing right ventricular infarction. Similarly, ST elevation in leads V7 through V9 adds significantly to precordial ST depression in aiding the diagnosis of posterolateral AMI. The authors contend that recording leads V4R and V7 through V9 is an additional step in the performance of a standard 12-lead ECG and, although recommended, may not be routinely performed. I will continue to do a V4R in all inferior AMIs, and a V7-8 at least in patients with ST depression in V1-3. Prognostic Value of Lead V1 ST Elevation During Acute Inferior Myocardial Infarction
Circulation. 2010 Aug 3;122(5):463-9